Chadron High School 2015 NeSA Results
 We are very excited to announce the results of our 2015 11th grade NeSA results. Once again, Chadron High School scored higher than the state average in all four subjects: Writing, Reading, Math, and Science.
Highlights include: Maintaining our excellent Writing scores over the past two years, increasing our Reading and Science proficiencies from last year, and significantly increasing the percentage of students ‘exceeding standards’ in Reading, Math, and Science.
Information about the Nebraska State Accountability (NeSA) tests: High school students are tested in four subjects (Writing, Reading, Math, and Science) during the spring of their junior year and results are provided in the fall. Students score into one of three categories on each test: ‘below standards’, ‘meets standards’, or ‘exceeds standards’. Proficiency is calculated by combining the ‘meets standards’ and the ‘exceeds standards’.
Writing scores were embargoed a year ago due to online testing issues with some schools in the state, so we compared results to our scores from two years ago. Our scores were almost exactly the same as the outstanding results from two years ago, we did have a slight increase in the percentage of students scoring into the ‘exceeds standards’ category. Our Writing proficiency is 7% higher than the state average.

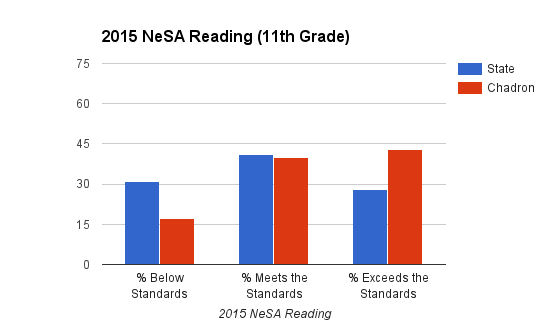
Reading had our largest increase in since last year’s scores. Our overall proficiency was 4% higher than last year and 14% higher than the state average. In addition, it is exciting to see that 43% of our students scored in the ‘exceeds standards’ category!
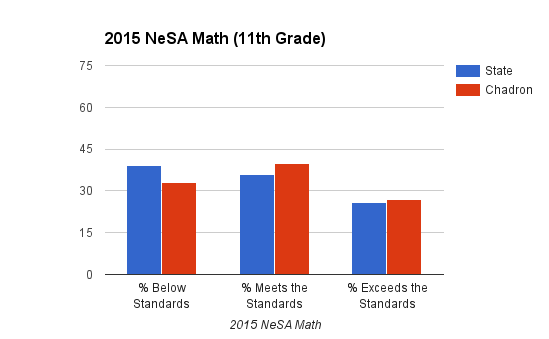
Math had our only decline in overall proficiency compared to last year’s outstanding scores. However, we had a 6% increase in students scoring into the ‘exceeds standards’ category and our Math proficiency is 5% higher than the state average.
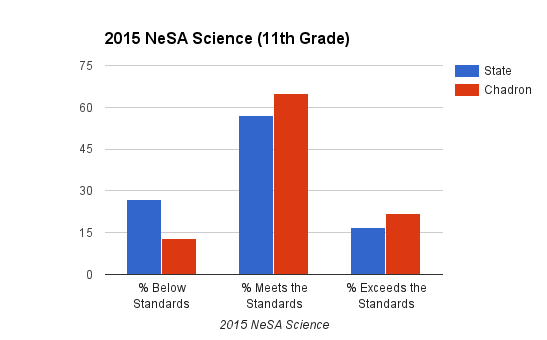
Science continues to be our subject with the highest proficiency percentage. We had 87% of our students scoring proficient which is 13% higher than the state average. Our goal for this subject was to move more students from ‘meets standards’ to ‘exceeds standards’. I’m proud to announce that we had a 12% increase in the ‘exceeds’ category since last year!
(The following is a news release by the Nebraska Department of Education on 8/25/15)
NEARLY THREE OF EVERY FOUR NEBRASKA
STUDENTS MEET STATE STANDARDS
The first of three reports on Nebraska public schools, students released today.
While the preliminary test scores released today are good news, showing that nearly three of every four Nebraska public school students met state standards in 2015, Education Commissioner Matt Blomstedt encouraged parents and the public to look at test results over time to evaluate the performance of individual students and schools ― not a single test score from one year.
“Overall this year, more Nebraska students met our state standards in reading, writing, math and science,” Blomstedt said, noting a 3 percent increase in student reading scores this year compared to 2014, and an 11 percent increase since 2010.
“Moving the needle from year-to-year is not easy. It takes hard work on the part of our students and Nebraska teachers,” Blomstedt said. Nebraska educators administered about 451,000 tests statewide in 2015.
Trend data showed state test scores have improved incrementally since testing began six years ago on reading standards, with testing in other subjects phased in yearly. Over 5 years, the percentage of students proficient on mathematics standards improved by 9 percent, science by 5 percent in four years and writing proficiency increased 4 percent over three years.
“Generally, we are seeing not only an increase in the percentage of students proficient on standards but also an increase in the percentage of students exceeding the standards,” Blomstedt said. “That means, Nebraska teachers are successfully increasing their students learning and knowledge of the standards, in general, at all grade levels.”
Even though the percentage of Nebraska students meeting state standards has improved, overall, Blomstedt said Nebraska can do better. “Going forward, we know we must focus on equity of educational opportunity and work to close the educational achievement gap among groups of students.” Historically, higher percentages of white students have met state standards when compared to groups of students by race and ethnicity as well as English Language Learners and students with special needs. The test results for groups of students will be released later.
NeSA TEST SCORES 2010-2015
Nebraska State Accountability: NeSA Scores
Percent Proficient: Meets/Exceeds Combined
Combined Results for All Grades Tested
2010
|
2011
|
2012
|
2013
|
2014
|
2015
| |
Reading
|
69%
|
72%
|
74%
|
77%
|
77%
|
80%
|
Mathematics
|
63%
|
67%
|
69%
|
71%
|
72%
| |
Science
|
67%
|
70%
|
72%
|
72%
| ||
Writing
|
68%^
|
—^^
|
72%
|
^In 2013, students at grades 8 and 11 experienced formatting issues with the NeSA-Writing online test administration. Scores should be interpreted with caution.
^^ In 2014, students in grades 8 and 11 experienced technology issues with the online NeSA-Writing test. Valid results are not available.